Report generation has been completely redesigned on OF3 and OF4.
- The objectives of this change are:
- Allow administrators to directly select from a library reports that interest them. There is no need to copy / paste SQL queries from the library of our documentation (https://openflyers.com/fr/doc/of3/Bibliothèque-des-rapports), complicated operation for non-computer .
- Propose intelligent filter is performed first in the selection of a report. Then OpenFlyers displays useful filters to the report. In the old version first asked filters and then would select its report. Therefore, all fields were proposed while they were not all relevant.
- Propose a thematic classification reports and make them accessible directly from the menu.
- Automate the update reports. Now, reports are centralized in a common library. If the request for a report is changed, this change applies to all platforms. Previously, reports were broken during updates because queries were specific to each platform.
On OF3:
- In version 3.6, new reports are accessed via the "Reports" menu.
- The former sub-menu "Structure" is renamed "Custom Reports".
- The 2-specific reports that were in the "Generic" submenu can be found in "Special Reports."
- The menu item "Edit Favorites reports" displays a list of all reports designed and maintained by OpenFlyers. You can test each one and choose the reports "favorites" (see below).
- The following sub-menus contain the OpenFlyers reports added to favorites and classified by themes.
- The report generation can be refined by means of filters.
- The report results are displayed in a separate page.
See the documentation for OF3: https://openflyers.com/fr/doc/of3/Gestion-des-rapports#Rapports
On OF4:
- The available reports are displayed in the user menu. They are identified by the white pictogram of a plug and a pie chart.
- By default, reports are sorted by theme files.
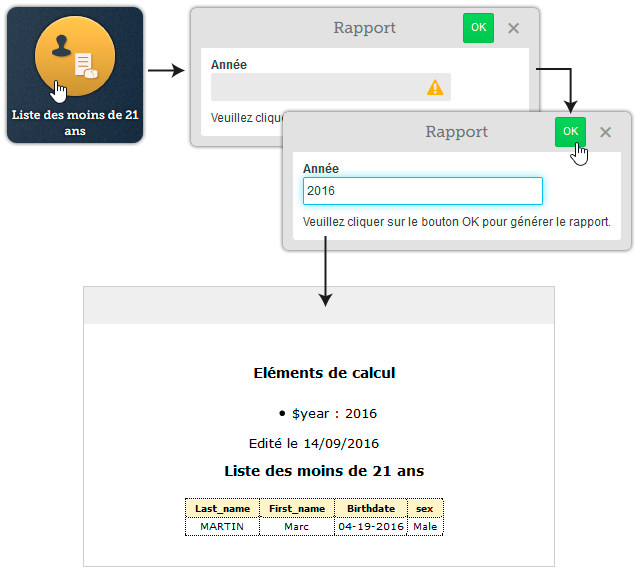
- A dialog box to generate the report selected using any filters.
- The report results are displayed in a separate page.